
The warehouse manager stands surrounded by boxes, some collecting dust for years, while other shelves sit mysteriously empty. Meanwhile, the finance director questions why capital remains tied up in stock while certain customer orders face constant delays. This disconnect represents more than miscommunication—it reveals a fundamental metric many businesses struggle to optimise: inventory turnover.
Inventory turnover ratio measures how efficiently a company sells and replaces its stock during a specific timeframe. Far from just another financial calculation, this figure reveals operational efficiency, cash flow health, and even market alignment. Companies with optimised inventory turnover typically outperform competitors in profitability by 20-30%, making this metric worth mastering.
When businesses optimise this ratio, they experience multiple benefits: reduced holding costs, minimised obsolescence risks, improved cash flow, and stronger customer satisfaction through consistent product availability. The challenge lies in finding your optimal balance point—the turnover sweet spot that maximises these advantages without creating stockouts or operational disruptions.
Defining Inventory Turnover: Beyond Basic Numbers
At its core, the inventory turnover ratio represents how many times a company sells and replaces its inventory during a specific period. This seemingly simple metric carries profound implications across departments:
- For finance: Capital efficiency and liquidity management
- For operations: Production scheduling and warehouse utilisation
- For sales: Product availability and fulfilment capabilities
- For purchasing: Order timing and quantity decisions
The standard inventory turnover formula divides sales by average inventory:
Inventory Turnover Ratio = Cost of Goods Sold / Average Inventory Value
This calculation provides insight into how many times you "turn" your inventory during the measurement period. A ratio of 6 means you effectively sell and replace your entire inventory six times annually.
Some businesses prefer alternative calculation approaches:
- Sales-based approach: Uses revenue instead of COGS (helpful for retailers with consistent markup)
- Unit-based calculation: Measures physical units rather than financial values (eliminates price fluctuation effects)
- Category-specific analysis: Calculates separate ratios for different product lines
Each approach offers unique insights, but the COGS-based calculation represents the industry standard for financial reporting and competitive benchmarking.
Calculating Your Inventory Turnover Ratio: Practical Steps
Calculating your inventory turnover ratio requires accessible data points and straightforward math. Follow this process for accurate results:
- Determine your measurement period (typically 12 months)
- Calculate your Cost of Goods Sold for this period
- Determine your average inventory value using this inventory turnover ratio equation:
Average Inventory = (Beginning Inventory + Ending Inventory) / 2
- Divide COGS by Average Inventory
For example:
- Annual COGS: $1,200,000
- January 1 Inventory: $250,000
- December 31 Inventory: $150,000
- Average Inventory: $200,000
- Inventory Turnover Ratio: 6 (inventory turns over six times annually)
For more precision, many businesses calculate average inventory using monthly or quarterly values rather than simply beginning and ending figures. This approach produces more accurate results for businesses with seasonal fluctuations.
The measurement period significantly impacts interpretation. While annual calculations provide a strategic overview, quarterly or monthly turnover metrics deliver tactical insights, revealing seasonal patterns and allowing for timely adjustments.
You can also derive the related "Days Sales of Inventory" (DSI) metric by dividing 365 by your turnover ratio. In our example:
365 / 6 = 60.8 days
This tells you inventory sits approximately 61 days before selling—a valuable cash flow planning metric.
Industry Benchmarks and Context

What constitutes "good" average inventory turnover varies dramatically across industries:
- Grocery stores: 12-18 (selling entire inventory every 20-30 days)
- Furniture retailers: 3-5 (turnover every 73-122 days)
- Automotive dealers: 6-8 (turnover every 46-61 days)
- Electronics manufacturers: 4-6 (turnover every 61-91 days)
- Fashion retailers: 4-6 (turnover every 61-91 days)
These variations reflect fundamental business model differences. Perishable goods naturally require faster turnover than durable equipment. High-margin products can afford slower turns than low-margin items, requiring volume efficiency.
Context matters tremendously when interpreting your ratio. A turnover rate of 4 might indicate inefficiency for a convenience store but represent exceptional performance for a luxury furniture retailer. Always benchmark against:
- Industry peers operating similar business models
- Your historical performance trends
- Specific business objectives (growth vs. profitability focus)
Some businesses strategically maintain lower turnover rates to ensure product availability or capitalise on anticipated price increases. Others prioritise extremely high turnover to minimise holding costs and maximise freshness. The "right" ratio aligns with your specific business strategy rather than arbitrary benchmarks.
Improving Your Inventory Turnover: Strategic Approaches
Businesses seeking improved inventory efficiency can implement targeted strategies across multiple operational areas:
Supply Chain Optimisation:
- Implement just-in-time ordering systems for high-volume items
- Negotiate faster supplier delivery for regularly stocked products
- Develop vendor-managed inventory arrangements with key suppliers

Demand Forecasting Improvements:
- Analyse sales data to identify seasonal patterns requiring adjustment
- Implement statistical forecasting methods beyond basic averages
- Segment product forecasting by sales velocity categories
Operations Enhancements:
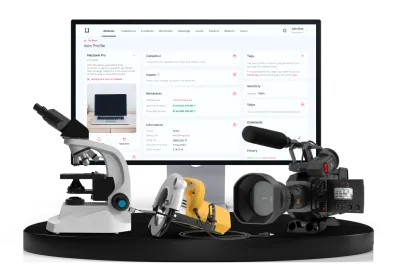
- Deploy equipment checkout software to track movable assets that support inventory handling
- Redesign warehouse layouts to prioritise high-turnover items
- Implement cycle counting instead of disruptive full inventories
Pricing and Marketing Strategies:
- Create targeted promotions for slow-moving inventory
- Implement quantity-based pricing tiers to move larger volumes
- Bundle slow-moving items with popular products
Technology Applications:
- Implement automated reordering at predetermined thresholds
- Use analytics platforms to identify sales velocity changes early
- Deploy inventory management systems with real-time visibility
A construction materials supplier increased their turnover from 4.2 to 7.8 annually by implementing three targeted changes: order frequency adjustments, supplier delivery schedules, and warehouse organisation based on turnover rates. This improvement released $3.7 million in cash previously tied up in excess inventory.